![]() (1)
(1)
The Wheatstone Bridge and Specific Resistance
MOTIVATION:
For years, one very convenient and certainly the most accurate instrument used for resistance measurements has been the Wheatstone Bridge. While today other instruments, notably the digital multimeter, are more convenient and just as precise for DC resistance measurements, the bridge technique still remains unsurpassed for making AC impedance measurements.
In this experiment, the slidewire form of the Wheatstone bridge will be used to measure the resistance of several coils of wire. From these measurements you will be able to calculate the resistivity, or specific resistance, of the wires. This value is characteristic of the material used to make the wires, and is independent of the dimensions of the wire. Knowledge of characteristic properties of materials is one of the most significant fields of physics and engineering, for such information allows technological advance.
SPECIFIC OBJECTIVES:

When you have completed this experimental activity, you should be able to: (1) set up and use correctly the slidewire form of the Wheatstone bridge; (2) determine the resistivity of a material; and (3) be able to look up standard values in reference books.
THEORY:
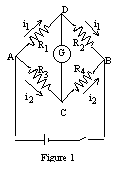
To the theoretician, the Wheatstone bridge is a circuit as shown in figure 1, consisting of 4 resistors bridged by a galvanometer. The dry cell is a source of current, the key a simple switch.
In order to balance the bridge, points C and D must have the same potential. When this condition is met, then no current passes through the galvanometer, and it shows no deflection when the key is down. By application of Ohm's law to the circuit, the potential drop from A to D is VAD = I1R1, and the potential drop from A to C is VAC = I2R3. Since C and D are at the same potential, the potential drops must be the same, or
![]() (1)
(1)
Likewise, the potential drop from D to B equals the potential drop from C to B, which gives
![]() (2)
(2)
Now a little algebra gives us
![]() (3)
(3)
from which we get the ratio
![]() (4)
(4)
Obviously, if three of the four resistances are known, the fourth is easily computed.
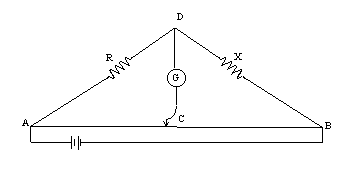
In this experiment, in which a slidewire bridge is used, the resistances R3 and R4 are replaced by a wire, AB, of uniform diameter, and a sliding contact key, C (see figure 2). Because the wire is uniform in diameter, its resistance is directly proportional to its length. The sliding key divides the wire into two segments, whose resistances are proportional to the segment lengths. Thus, by measuring the lengths of segments AC and BC, it is possible to determine the ratio of R3/R4 as
![]() (5)
(5)
where AC and BC are the lengths of the two wire segments. The units cancel on both sides of the relation, and the ratio is a unitless number.
Now, we use a known value for R1 by using a resistance substitution box, sometimes referred to as a "decade resistance," and R2 becomes the unknown value, X, which we wish to measure. Combining equations (4) and (5) with this information, one finds
![]() (6)
(6)
which can be rearranged algebraically to solve for the value of X as
![]() (7)
(7)
It is found that the resistance (R) of a conductor depends on the material of which it is made, its length (L), its cross-sectional area (A), and the temperature. For a conductor at constant temperature, the resistance is given by
![]() (8)
(8)
where R is the resistance in ohms, L is the length in meters, and A is the cross-sectional area in square meters. The proportionality constant r is the resistivity of the material, in ohm-meters, and is constant for a given material at a single temperature.
EXPERIMENTAL ACTIVITY:
At your workstation should be a slidewire apparatus, a power supply, a galvanometer, a decade resistance, and a small box containing eight resistance coils. One of the coils is made of copper wire, and the other seven are an alloy, either silver-nickel or constantan. Six of the alloy coils are wound with various lengths of the same diameter wire, and the seventh is wound with a larger diameter wire.

Figure 2
Assemble the apparatus as shown in the schematic figure 2, and set the decade resistance to 10 ohms. Keeping each coil separate, measure the resistance of each coil by determining the distance along the slidewire where the bridge circuit is balanced for that coil. Record the AC distance in your data table, leaving a blank column beside it for resistance value.
Set the decade resistance to a new value, say 18 ohms, and remeasure all eight coils in the same way. Measure the coils a third time by setting the decade resistance to a value of your own choosing, picking a value that exceeds 20 ohms. Be sure to clearly indicate the value of R1 for each measurement or group of measurements, so that no confusion will occur when the data is analyzed. Your data should also indicate length, diameter, and composition of each wire.
Analyze the raw data by determining the resistance value for each measurement, and record those values beside the "raw" measurement of AC length. You should also provide an average of the three values determined for each coil. The average can be assumed to be a "best" value for the resistance of the coil.
Using the resistance values for the six alloy coils with wire of the same diameter, plot a graph of resistance versus length of coil. Since these six coils have wire of the same diameter, the cross sectional areas are the same, and the graph should be linear. The slope of this line should be equal to ( ρ /A). Find the slope and compute the value of ρ, the resistivity.
Use this computed value of r to predict the resistance value for the seventh alloy coil. Compare the predicted and experimental values by computing the percent difference.
Finally, use the data values of R, L, and A for the copper coil to find its resistivity. A standard value for the resistivity of copper can be found in the Handbook of Chemistry and Physics or a similar reference book. Look up the value, and compare your experimental value to the standard value by using percent error.
FINAL SUMMARY:
In your summary, you should report your experimental values for the resistivity of both copper and the alloy material. You should indicate conclusions about what the linear nature of the graph shows, and the significance of the value of material properties.
Your section on estimates of accuracy should report the comparisons for the resistivity of copper, and the comparison between measured and predicted values for the seventh alloy coil.